
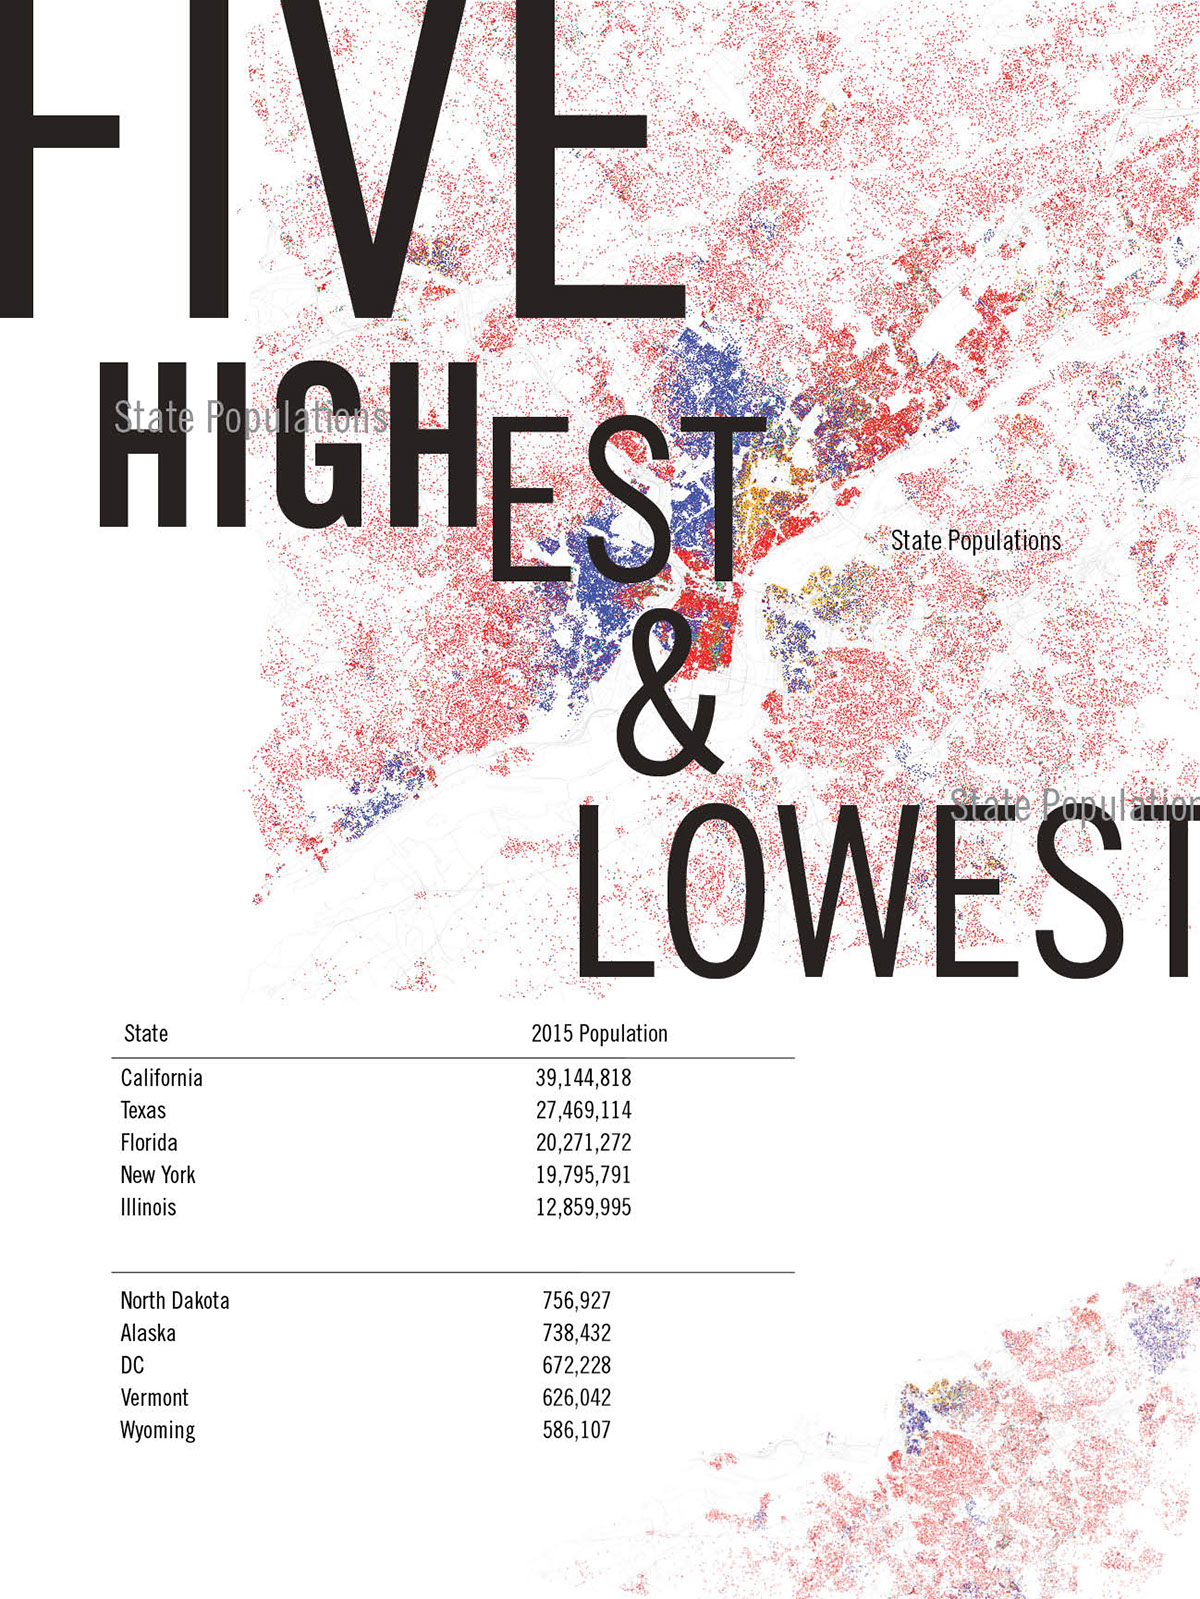
I found a set of data and created a typographic data poster. I chose to use the five highest and lowest populated states on my poster. Using different alignments and sizes I created different compositions. I then found an image to support the information, not overpower it.
The images here is a sky view of the night lights of Chicago suburbs.
This poster I found an image of coins in some kind of liquid. I then used photoshop to make it into a duotone to give it a slighting less subjective feeling.


